The Western Cape has recorded its highest matric pass rate on record, marking a significant moment in South Africa’s education landscape. For the Class of 2025, the province achieved a pass rate of 88.2 percent, surpassing its previous best and reinforcing its reputation as a consistently strong performer in the national schooling system. The improvement from the 86.6 percent achieved the year before reflects steady gains rather than a statistical anomaly, pointing to sustained effort across schools, educators and learners.
This milestone arrives at a time when education outcomes are under intense public scrutiny, particularly in the wake of pandemic disruptions and ongoing socio economic pressures. The latest results offer a counter narrative, suggesting that focused intervention, administrative stability and learner support can translate into measurable success. For many families, the figures represent more than percentages, they reflect years of personal sacrifice, persistence and hope invested in education as a pathway to opportunity.
Quality Of Passes Strengthened
Beyond the headline pass rate, the Western Cape’s bachelor’s pass rate rose to 49.2 percent, the highest in the province’s history and among the strongest nationally. This indicator is widely regarded as a measure of academic depth, as it reflects the number of learners qualifying for degree level study at tertiary institutions. The growth in bachelor passes suggests not only higher completion rates, but improved academic outcomes within the cohort.
Provincial Education Minister David Maynier framed the results as evidence of collective discipline and accountability within the system. In announcing the figures, he said the outcomes demonstrated a commitment to quality rather than minimal compliance.
Our bachelor’s pass rate, a key indicator of quality matric passes, has also risen to 49.2 percent, which is the highest ever for the Western Cape and the second highest in the country
His remarks underscored a policy emphasis on meaningful educational progression rather than numerical success alone.
Strong Performance In Key Subjects
Performance in gateway subjects further strengthened the province’s standing. Mathematics achieved a pass rate of 73.7 percent, while Physical Science recorded 80.6 percent, the second highest nationally. These subjects are often seen as barometers of systemic strength, given their role in unlocking careers in engineering, health sciences and technology driven fields.
The results indicate a sustained focus on subject specific support, curriculum coverage and teacher development. For learners, success in these disciplines carries long term implications, influencing access to scarce skills pathways and economic mobility. The outcomes also counter persistent concerns about declining performance in mathematics and science, particularly in public schools serving diverse communities.
Inclusive Success For Special Needs Learners
Candidates with Special Education Needs also delivered standout results, achieving an overall pass rate of 91.9 percent and a bachelor’s pass rate of 60.4 percent, the second highest nationally for this group. These figures highlight progress in inclusive education, an area historically marked by uneven resourcing and limited visibility.
The strong showing reflects targeted support structures, specialist educators and adaptive assessment approaches within the provincial system. It also reinforces the principle that academic excellence is not confined to conventional learning environments. The recognition of diverse learner capabilities adds an important dimension to the broader narrative of achievement emerging from the 2025 results.
Improved Retention And Completion
Another notable development is the province’s retention rate, which climbed to 70.0 percent, the highest since 2021. Retention measures how many learners who start high school ultimately reach matric, making it a critical indicator of systemic resilience and learner support.
The improvement suggests that fewer learners are dropping out before completing their schooling, a trend with far reaching social and economic implications. Higher retention increases the pool of matriculants entering the labour market or further study, while reducing the long term costs associated with youth disengagement and unemployment.
Individual Excellence Highlights Results
Amid the aggregate data, individual stories of achievement have also emerged. Abigail Kok from York High School in George was named the top matric candidate for 2025, marking the fifth consecutive year that the country’s top achiever has come from the Western Cape. She also achieved the highest mark in Physical Science, reinforcing the province’s strong performance in key subjects.
Takunda Muchuweni from Jan Kriel School in Kuils River was recognised as the top Special Education Needs candidate nationally, a distinction that underscores both personal determination and institutional support. These achievements provide human context to the statistics, illustrating how systemic investment translates into individual success.
National Context And Comparative Results
Nationally, the Class of 2025 delivered a record matric pass rate of 88 percent, reflecting broad based improvement across provinces. KwaZulu Natal led with 90.6 percent, followed by the Free State at 89.33 percent and Gauteng at 89.06 percent. The Western Cape’s performance places it firmly within this top tier, while distinguishing itself through consistency and quality indicators.
The following table summarises key provincial and national statistics referenced in the 2025 matric outcomes.
| Indicator | Result |
|---|---|
| Western Cape Pass Rate | 88.2% |
| Western Cape Bachelor Pass Rate | 49.2% |
| Mathematics Pass Rate | 73.7% |
| Physical Science Pass Rate | 80.6% |
| LSEN Overall Pass Rate | 91.9% |
| Western Cape Retention Rate | 70.0% |
| National Pass Rate | 88% |
Collective Effort Behind The Results
Education authorities have emphasised that the outcomes are the product of collaboration across the system. Teachers, school management teams and parents were singled out for their sustained involvement in supporting learners through the final and most demanding year of schooling.
In acknowledging this collective contribution, Maynier extended appreciation to those working behind the scenes.
Thank you to our matric teachers who have done an outstanding job supporting our candidates this year, and to our matric parents, who now get to celebrate this milestone with their children
The message serves as both recognition and a call to maintain momentum as the next cohort prepares for its final examinations.
A National Snapshot Of Determination And Progress
The release of the 2025 matric results marks a defining moment for learners across South Africa, with the Class of 2025 delivering outcomes that reflect resilience, academic growth and sustained determination. After navigating one of the most demanding phases of their schooling, candidates nationwide demonstrated an ability to adapt, persist and perform, producing results that signal both progress and promise within the education system.
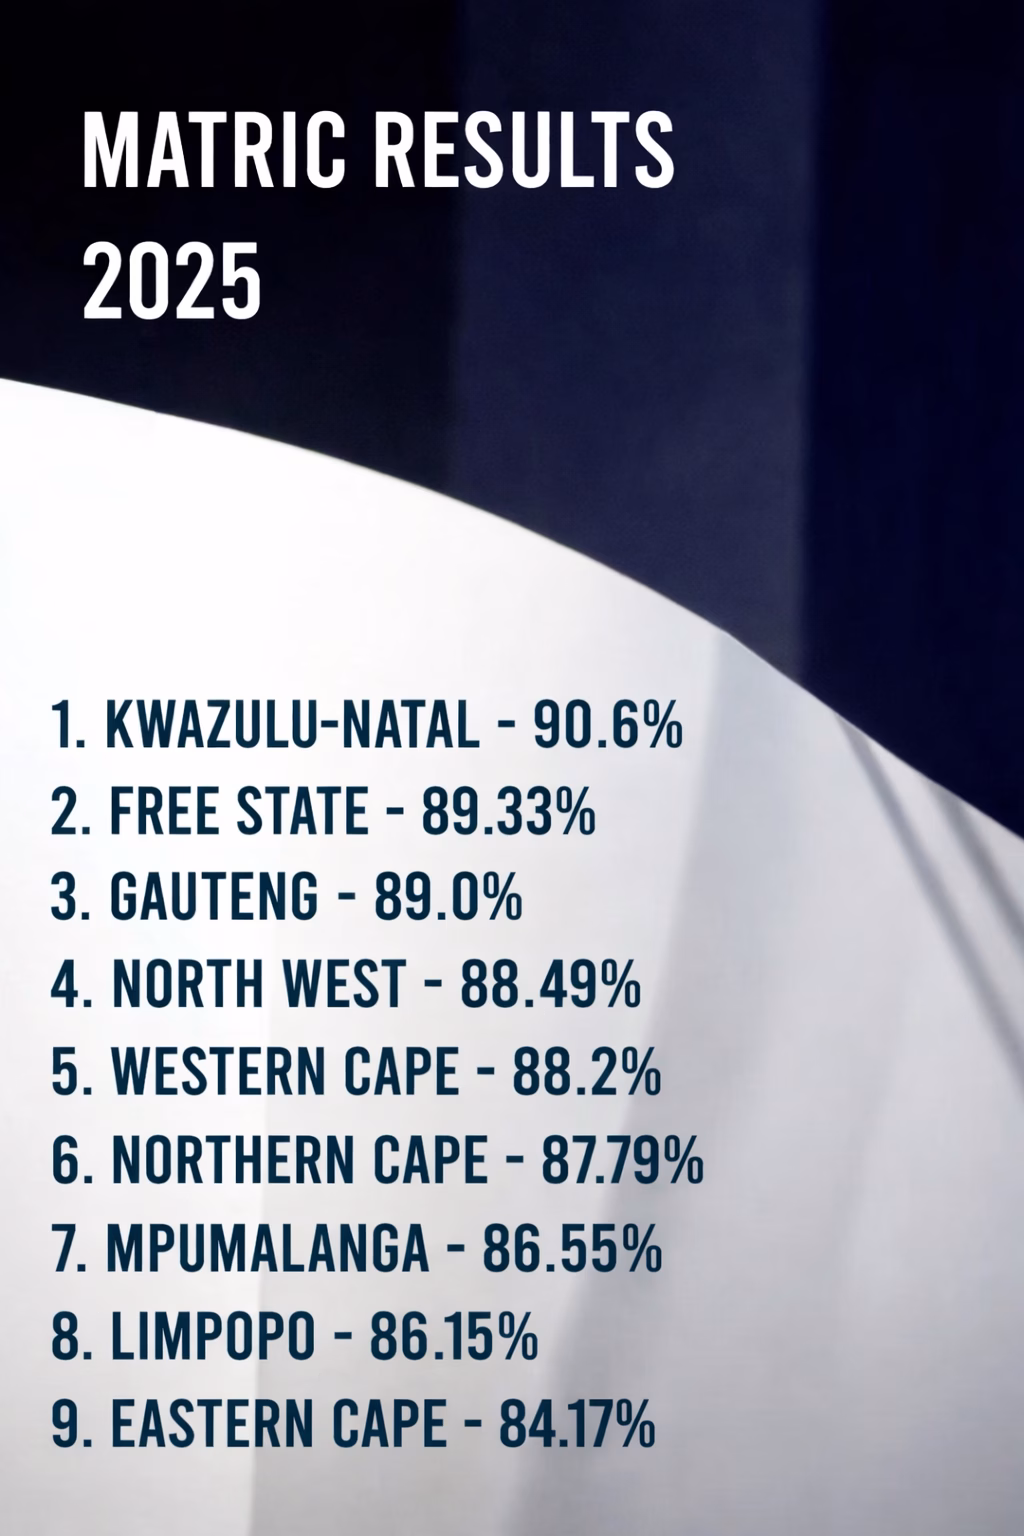
KwaZulu Natal emerged as the leading province with a 90.6 percent pass rate, setting a high benchmark through consistent performance and focused academic management. The Free State followed closely on 89.33 percent, with Gauteng recording 89.0 percent, reaffirming their status as long standing academic powerhouses. North West achieved a strong 88.49 percent, while the Western Cape posted 88.2 percent, keeping competition at the upper end of the national rankings closely contested.
Further down the table, the Northern Cape recorded 87.79 percent, Mpumalanga reached 86.55 percent and Limpopo achieved 86.15 percent, reflecting steady improvements and continued efforts to strengthen learner outcomes. The Eastern Cape closed the national list with 84.17 percent, underscoring both the structural challenges faced in the province and the untapped potential that remains within its schooling system.
Beyond the statistics, the results tell a deeper story of commitment and perseverance. They represent countless hours of preparation, the guidance of dedicated teachers, the support of families and the determination of learners who chose persistence over discouragement. For the Class of 2025, these results are not merely an endpoint, but a foundation for the next stage of their personal, academic and professional journeys.